Send the logs of your Shuttle-powered backend to Datadog

Learn how to send logs to Datadog from your Shuttle powered backend.
IMPORTANT: This post is OUTDATED. Visit the reviewed version.
Some words about observability
As we all know, being able to ‘see’ what’s going on in our services can be critical in many ways. We can easily find bugs or identify undesired behaviors, and it’s certainly an invaluable tool at our disposal.
Observability, in software, refers to the ability to understand the state of a system and its behavior by collecting, analyzing, and presenting data about its various components and interactions. This enables engineers to diagnose and resolve issues and make informed decisions about system health and performance.
Observability is critical for ensuring the reliability, scalability, and performance of modern systems, and is becoming increasingly important as software continues to play a larger role in our daily lives.
Fortunately, in the Rust ecosystem, we have Tokio Tracing which is a powerful framework for instrumenting Rust programs to collect structured, event-based diagnostic information. It provides a convenient and flexible API for collecting and viewing traces of events in your application and you can easily add context and structure to your traces, making it easier to identify bottlenecks and debug issues.
Shuttle logs
A few weeks ago, I wrote a post about Shuttle, where I explained how ridiculously easy it is to deploy a Rust backend to the cloud by using their CLI tool.
Shuttle is still in alpha, and although its observability features are not really polished yet, they offer support for Tokio Tracing and a way to view logs by using their CLI tool.
By simply running cargo shuttle logs --follow, you will be able to see something like this:

This is great for simple applications, but what if you want to send your logs to a more powerful tool like Datadog? Well, in this post, I’ll show you how to do it.
Datadog
Datadog is a monitoring and observability platform that provides a single pane of glass for your infrastructure and applications. It is a cloud-based service that allows you to collect, aggregate and analyze your data, and it is extremely powerful.
As a disclaimer, I must say that I’m currently working at Datadog, so I’m a bit biased, but I’m also a huge fan of the product and I think it’s a great tool for developers
.
Most of the time, the easiest way to send anything to the Datadog platform is by using the Datadog Agent, but in this case, as we cannot install it in any way, we will use a small library I created for the occasion called dd-tracing-layer, which happens to be using the Datadog HTTP API under the hood to send logs to the Datadog platform.
How to use tracing with Shuttle
If we check the Shuttle documentation, we can read this:
When you build an app with the
#[shuttle_service::main]macro, a global subscriber will be created and installed behind the scenes. This means you can skip this step when implementing tracing in your application, all you have to do is add tracing as a dependency in your Cargo.toml, and you’re good to go!
// [...]
use tracing::info;

#[shuttle_service::main]
async fn axum(#[shuttle_shared_db::Postgres] pool: PgPool) -> ShuttleAxum {
    info!("Running database migration");
    pool.execute(include_str!("../schema.sql"))
        .await
        .map_err(CustomError::new)?;

    // [...]
}
So, as you can see, it seems that the Shuttle macro is already instantiating and initializing a tracing subscriber for us.
This is pretty convenient for most of the simple cases, but unfortunately, it’s not enough for our purposes.
Ideally, if we had access to the underlying infrastructure, we could probably install the Datadog Agent and configure it to send our logs directly to Datadog, or even use AWS Lambda functions or Azure Event Hub + Azure Functions in case we were facing some specific cloud scenarios.
You can check the Datadog docs for log collection and integrations if you want to learn more.
Those solutions are generally great because they allow us to remove the burden of sending our logs to Datadog from our application, thus becoming the responsibility of the platform itself.
If we could do something like that with Shuttle, it would be great. Probably, it would be still nice to be able to customize the subscriber before its initialization in order to filter out some logs or add some context to them, but at least we wouldn’t have to worry about sending our logs to Datadog from our application.
But, as we just mentioned, in the case of Shuttle, we don’t have access to the underlying infrastructure, so we need to find a way to send our logs to Datadog from our application, and that’s what we are going to try to do in this post.
Getting access to the subscriber
So, the basic idea is to add a new tracing layer to the subscriber which will be responsible for sending our logs to Datadog.
But for that, we’ll need to get access to the subscriber instance prior to its initialization, and, at the moment of writing this post, there doesn’t seem to be a way to make that possible out of the box.
So… it seems that our only solution is to get rid of the #[shuttle_service::main] macro and go macro-less!
Walking on the wild side
Fear not! It’s not as bad as it sounds. Of course, this is a workaround, and hopefully the Shuttle team will provide a better solution for this in the future, but for now, this is the only solution we have.
As a walkthrough, we are going to create a new Shuttle project from scratch.
The idea is to build a simple REST API using Axum and send our logs to Datadog using the dd-tracing-layer crate.
This backend will also have a simple PostgreSQL database, which will be managed by using the Shuttle Shared Database plugin and will also serve some static files.
Although I’m going to describe all the steps you need to take to make this work, you can see the final state of the project in this GitHub repository. Feel free to use it as a reference.
Creating a new project
First of all, we need to create a new Shuttle project. You can do that by using the Shuttle CLI:
cargo shuttle init --axum
Follow the instructions and you should have a new project ready to go. I called mine shuttle-datadog-logs but use the name you want.
Replacing the Shuttle macro
Once you have your project ready, you need to remove the #[shuttle_service::main] macro.
Find the axum function in the src/lib.rs file and remove the #[shuttle_service::main] macro from it.
In case you are trying to instrument an already existing project and you’re using some of the Shuttle features/plugins, you’ll need to remove the macros associated to them in the
axumfunction, too.
So, make sure you get rid of these macros if already present:
#[shuttle_shared_db::Postgres]#[shuttle_secrets::Secrets]#[shuttle_static_folder::StaticFolder]
Don’t worry, I’ll explain later how to inject those dependencies.
Adding some dependencies
In our example, we are going to be using these Shuttle features:
So make sure you have the following dependencies in your Cargo.toml file:
# secrets
shuttle-secrets = "0.9.0"
# database
shuttle-shared-db = { version = "0.9.0", features = ["postgres"] }
sqlx = { version = "0.6.2", features = ["runtime-tokio-native-tls","postgres"] }
# static files
shuttle-static-folder = "0.9.0"
tower-http = { version = "0.3", features = ["fs"] }
Note that these are optional dependencies and depending on the kind of project you’re working on you may not need them at all. I just added them to show you how to inject them in the
axumfunction in case you need them.
Aside from that, as we’re going to deal with tracing, we’ll need to add the following dependencies:
tracing = "0.1"
dd-tracing-layer = "0.1"
Instrumenting a little bit the default project
Now that we have our dependencies ready, we can start instrumenting our project a little bit.
Note that we have added the #[instrument] macro to the hello_world function and added a tracing::info! log to it.
use sync_wrapper::SyncWrapper;
use tracing::instrument;

#[instrument]
async fn hello_world() -> &'static str {
    tracing::info!("Saying hello");
    "Hello, world!"
}

async fn axum(
    _pool: PgPool,
    _secret_store: SecretStore,
    _static_folder: PathBuf,
) -> shuttle_service::ShuttleAxum {
    let router = Router::new().route("/hello", get(hello_world));
    let sync_wrapper = SyncWrapper::new(router);
    Ok(sync_wrapper)
}
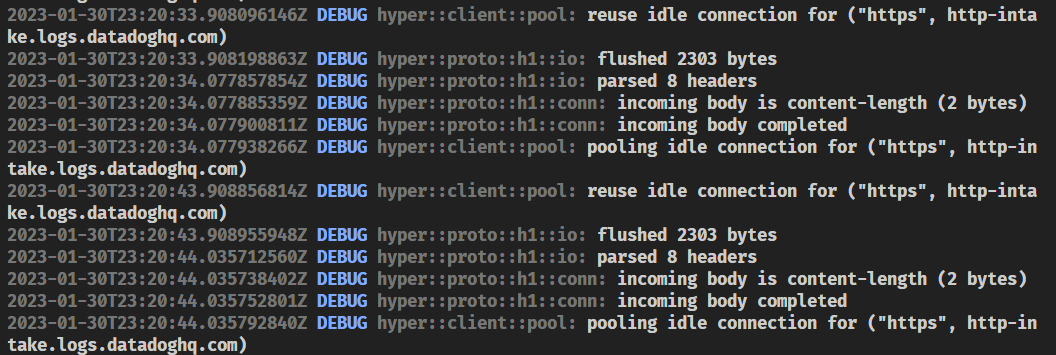
At this point, if you try to run the project locally by using the shuttle run command, you should see the following output:

Providing the Shuttle entrypoint
As we have removed the #[shuttle_service::main] macro, we need to provide our own entrypoint.
We will be adding two new functions to our src/lib.rs file:
-
_create_service: This is the entrypoint for our application. It will be called by the Shuttle runtime and it needs to be called exactly like this. -
main: This is the function that will be called by the_create_servicefunction. It will be the one that will start our application and instantiate all the dependencies we may need in ouraxumfunction (db, secrets, static files folder, etc.).
Just copy and paste the following code in the src/lib.rs file:
async fn main(
    factory: &mut dyn shuttle_service::Factory,
    runtime: &shuttle_service::Runtime,
    logger: shuttle_service::Logger,
) -> Result<Box<dyn shuttle_service::Service>, shuttle_service::Error> {
    todo!("Instantiate dependencies and start the axum service");
}

#[no_mangle]
pub extern "C" fn _create_service() -> *mut shuttle_service::Bootstrapper {
    use shuttle_service::Context;
    let bootstrapper = shuttle_service::Bootstrapper::new(
        |factory, runtime, logger| Box::pin(main(factory, runtime, logger)),
        |srv, addr, runtime| {
            runtime.spawn(async move {
                srv.bind(addr)
                    .await
                    .context("failed to bind service")
                    .map_err(Into::into)
            })
        },
        shuttle_service::Runtime::new().unwrap(),
    );
    let boxed = Box::new(bootstrapper);
    Box::into_raw(boxed)
}
Now, we’re going to implement the main function.
Adding our tracing subscriber
The first thing we’re going to do is to add a tracing subscriber to our application.
Then we will add the Datadog Tracing layer to our subscriber along with the Shuttle Logger layer that we’ll get from the main function arguments.
Let’s do it! Add this code to the main function:
use shuttle_service::tracing_subscriber::prelude::*;
use dd_tracing_layer::{DatadogOptions, Region};

// datadog tracing layer
let dd_layer = dd_tracing_layer::create(
    DatadogOptions::new(
        // first parameter is the name of the service
        "shuttle-datadog-logs",
        // this is the Datadog API Key
        "21695c1b35156511441c0d3ace5943f4",
    )
    // this is the default, so it can be omitted
    .with_region(Region::US1)
    // adding some optional tags
    .with_tags("env:dev, version:0.1.0"),
);

// feel free to change this implementation
// this will set the tracing level according to the RUST_LOG env variable
// and will use INFO if it's not set
// NOTE that in production, this env var will be set to DEBUG by Shuttle
// so you could skip the env var part and just use the level that you want
let filter_layer =
    shuttle_service::tracing_subscriber::EnvFilter::try_from_default_env()
        .or_else(|_| shuttle_service::tracing_subscriber::EnvFilter::try_new("INFO"))
        .unwrap();

// starting the tracing subscriber
runtime
    .spawn_blocking(move || {
        shuttle_service::tracing_subscriber::registry()
            .with(filter_layer)
            // note that we added the datadog layer here
            .with(dd_layer)
            // and the shuttle logger layer
            .with(logger)
            .init();
    })
    .await
    .map_err(|e| {
        if e.is_panic() {
            let mes = e
                .into_panic()
                .downcast_ref::<&str>()
                .map(|x| x.to_string())
                .unwrap_or_else(|| "panicked setting logger".to_string());
            shuttle_service::Error::BuildPanic(mes)
        } else {
            shuttle_service::Error::Custom(
                shuttle_service::error::CustomError::new(e).context("failed to set logger"),
            )
        }
    })?;
Instantiating the dependencies
Now that we have our tracing subscriber ready, we can start instantiating our dependencies.
Let’s add this piece of code to the main function. As you can see, it’s pretty straightforward:
// shared database
let pool = shuttle_shared_db::Postgres::new()
    .build(factory, runtime)
    .await?;

// shuttle secret store
let secret_store = shuttle_secrets::Secrets::new()
    .build(factory, runtime)
    .await?;

// shuttle static folder support
let static_folder = shuttle_static_folder::StaticFolder::new()
    .build(factory, runtime)
    .await?;
Starting the axum service
Finally, let’s start our axum service.
This is the final part of the main function:
// starting the axum service and injecting the dependencies
runtime
    .spawn(async {
        axum(pool, secret_store, static_folder)
            .await
            .map(|ok| Box::new(ok) as Box<dyn shuttle_service::Service>)
    })
    .await
    .map_err(|e| {
        if e.is_panic() {
            let mes = e
                .into_panic()
                .downcast_ref::<&str>()
                .map(|x| x.to_string())
                .unwrap_or_else(|| "panicked calling main".to_string());
            shuttle_service::Error::BuildPanic(mes)
        } else {
            shuttle_service::Error::Custom(
                shuttle_service::error::CustomError::new(e).context("failed to call main"),
            )
        }
    })?
Adding a static folder
Before we run cargo shuttle run, as we added the Shuttle Static Folder plugin, we will need to add a static folder to our project. If not, the project will fail to start.
Let’s create a static folder in the root of our project and add an index.html file to it.
<!DOCTYPE html>
<html lang="en">
  <head>
    <meta charset="UTF-8" />
    <meta http-equiv="X-UA-Compatible" content="IE=edge" />
    <meta name="viewport" content="width=device-width, initial-scale=1.0" />
    <title>Shuttle Datadog logs</title>
  </head>
  <body>
    Welcome to the Shuttle Datadog logs app!
  </body>
</html>
Then, we can add a new endpoint in our axum function to serve this html.
This should be the current implementation:
use axum::{
    http::StatusCode,
    response::IntoResponse,
    routing::{get, get_service},
    Router,
};
use tower_http::services::ServeDir;

#[instrument]
async fn handle_error(error: std::io::Error) -> impl IntoResponse {
    tracing::error!(?error, "Error serving static file");
    (StatusCode::INTERNAL_SERVER_ERROR, "Something went wrong...")
}

async fn axum(
    pool: PgPool,
    _secret_store: SecretStore,
    static_folder: PathBuf,
) -> shuttle_service::ShuttleAxum {
    let serve_dir = get_service(ServeDir::new(static_folder)).handle_error(handle_error);

    let router = Router::new()
        .route("/hello", get(hello_world))
        .route("/", serve_dir);
    let sync_wrapper = SyncWrapper::new(router);
    Ok(sync_wrapper)
}
Running the REST API
Run cargo shuttle run and go to http://localhost:8080 in your browser to see the static folder in action.

Now, let’s browse to http://localhost:8080/hello to see the hello_world endpoint in action.
Alternatively, you can also use curl to test the endpoint:
curl -i http://localhost:8080/hello
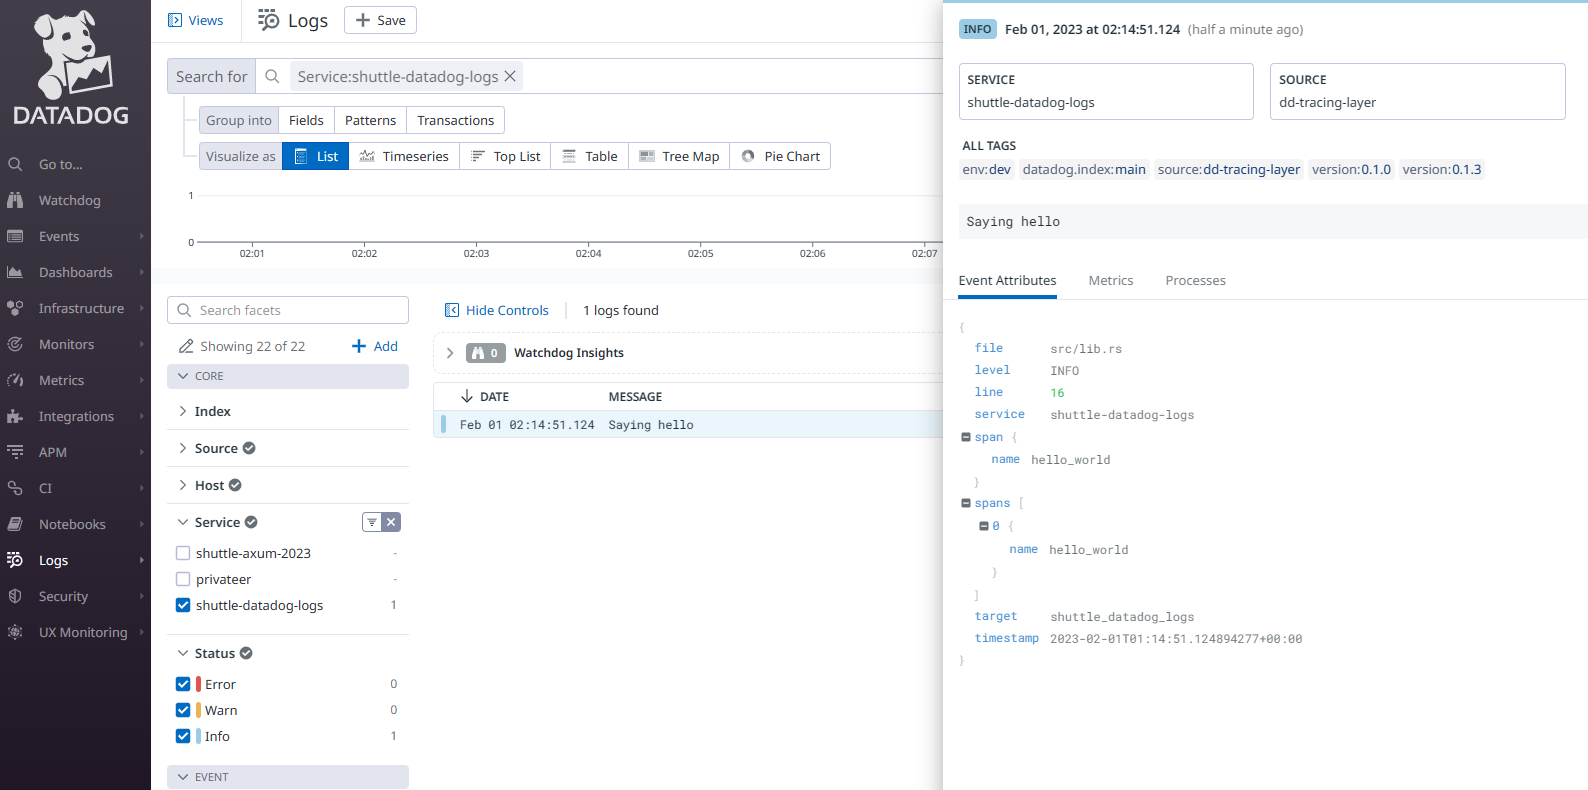
But remember that this endpoint was instrumented! So, if everything went well, we should be able to see the logs in Datadog.
Let’s check it out! ![]()

It works! ![]()
Using Secrets to store the Datadog API key
Wait a minute… we are using a hardcoded API key in our code. This is not a good practice. We should use a secret to store the API key.
Let’s add a new secret to our project. Create a file called Secrets.toml in the root of the project and add the following content:
# Secrets.toml file
DD_API_KEY="YOUR-DATADOG-API-KEY"
IMPORTANT: Don’t forget to add it to your
.gitignorefile.
Now, we will have to go to the main function and change the order in which the dependencies were instantiated.
Basically, we need to instantiate the secret store before the dd-tracing-layer is set, so we can get the DD-API-KEY secret from there and pass it to the dd-tracing-layer.
// shuttle secret store
let secret_store = shuttle_secrets::Secrets::new()
    .build(factory, runtime)
    .await?;

// getting the datadog api key from the secret store
let dd_api_key = secret_store
    .get("DD_API_KEY")
    .expect("DD_API_KEY not found");

// datadog tracing layer
let dd_layer = dd_tracing_layer::create(
    DatadogOptions::new(
        // first parameter is the name of the service
        "shuttle-datadog-logs",
        // this is the Datadog API Key
        dd_api_key,
    )
    // this is the default, so it can be omitted
    .with_region(Region::US1)
    // adding some optional tags
    .with_tags("env:dev, version:0.1.0"),
);

// ... rest of the code
You can test that everything works as expected by running the project again and checking the logs in Datadog.
Secrets per environment
Let’s try to do one more thing. Wouldn’t it be nice to be able to send different tags to Datadog in case we were running from different environments?
For example, we could add an env tag to the logs in dev and a prod tag in production. Something simple, for the sake of this exercise, and add different secrets for each environment.
Although, this is not supported yet, we can implement something similar.
Let’s change our Secrets.toml file to look like this:
DD_API_KEY="my-datadog-api-key"
DD_TAGS="env:production"
LOG_LEVEL="INFO"

# development environment
DD_TAGS_DEV="env:dev"
LOG_LEVEL_DEV="DEBUG"
Probably you’ve already guessed the idea. We are going to use the _DEV suffix to define the dev environment.
Add this small function to your lib.rs file:
fn get_secret(secret_store: &SecretStore, key: &str) -> Option<String> {
    let final_key = if cfg!(debug_assertions) {
        format!("{}_DEV", key)
    } else {
        key.to_string()
    };

    secret_store.get(&final_key)
}
Finally, we can use this function to get the DD_TAGS and LOG_LEVEL secrets:
// we are adding a version constant to the file
const VERSION: &'static str = "version:0.1.0";

// then we're getting the secrets in the main function
let tags = get_secret(&secret_store, "DD_TAGS")
    .map(|tags| format!("{},{}", tags, VERSION))
    .unwrap_or(VERSION.to_string());

let log_level = get_secret(&secret_store, "LOG_LEVEL").unwrap_or("INFO".to_string());

// NOTE: As we're defaulting to INFO, we're also getting rid of the environment variable support,
// as Shuttle will ingore env vars in production anyway.
let filter_layer = shuttle_service::tracing_subscriber::EnvFilter::try_new(log_level)
    .expect("failed to set log level");
That’s it! It’s not ideal, but it works! ![]()
Adding a database
And finally, let’s add a database to our project. We will be using PostgreSQL for this.
Let’s keep things simple, though. We will just add a messages table to our database and a new endpoint to get one message from that table. Feel free to expand this example to your needs.
Cool! ![]() Let’s create a file called
Let’s create a file called db.sql in the root of the project and add the following content:
-- schema
CREATE TABLE IF NOT EXISTS messages (
  id serial PRIMARY KEY,
  message text NOT NULL
);

-- add a message
INSERT INTO messages (id, message) VALUES (1, 'hello world from Database!') ON CONFLICT (id) DO NOTHING;
Now, let’s initialize the database in our axum function:
pool.execute(include_str!("../db.sql"))
    .await
    .map_err(CustomError::new)?;
Next, we’ll declare a new endpoint and share the pool as state:
let router = Router::new()
    // here we add the new endpoint
    .route("/message", get(message))
    .route("/hello", get(hello_world))
    .route("/", serve_dir)
    // set the state so we can get access to our database from the endpoints
    .with_state(pool);
Finally, we’ll create the message endpoint:
#[instrument(skip(db))]
async fn message(State(db): State<PgPool>) -> Result<String, (StatusCode, String)> {
    tracing::info!("Getting a message from the database");
    let row: (String,) = sqlx::query_as("SELECT message FROM messages LIMIT 1")
        .fetch_one(&db)
        .await
        .map_err(|e| (StatusCode::INTERNAL_SERVER_ERROR, e.to_string()))?;
    let msg = row.0;
    tracing::info!(?msg, "Got message from database");
    Ok(msg)
}
Done!
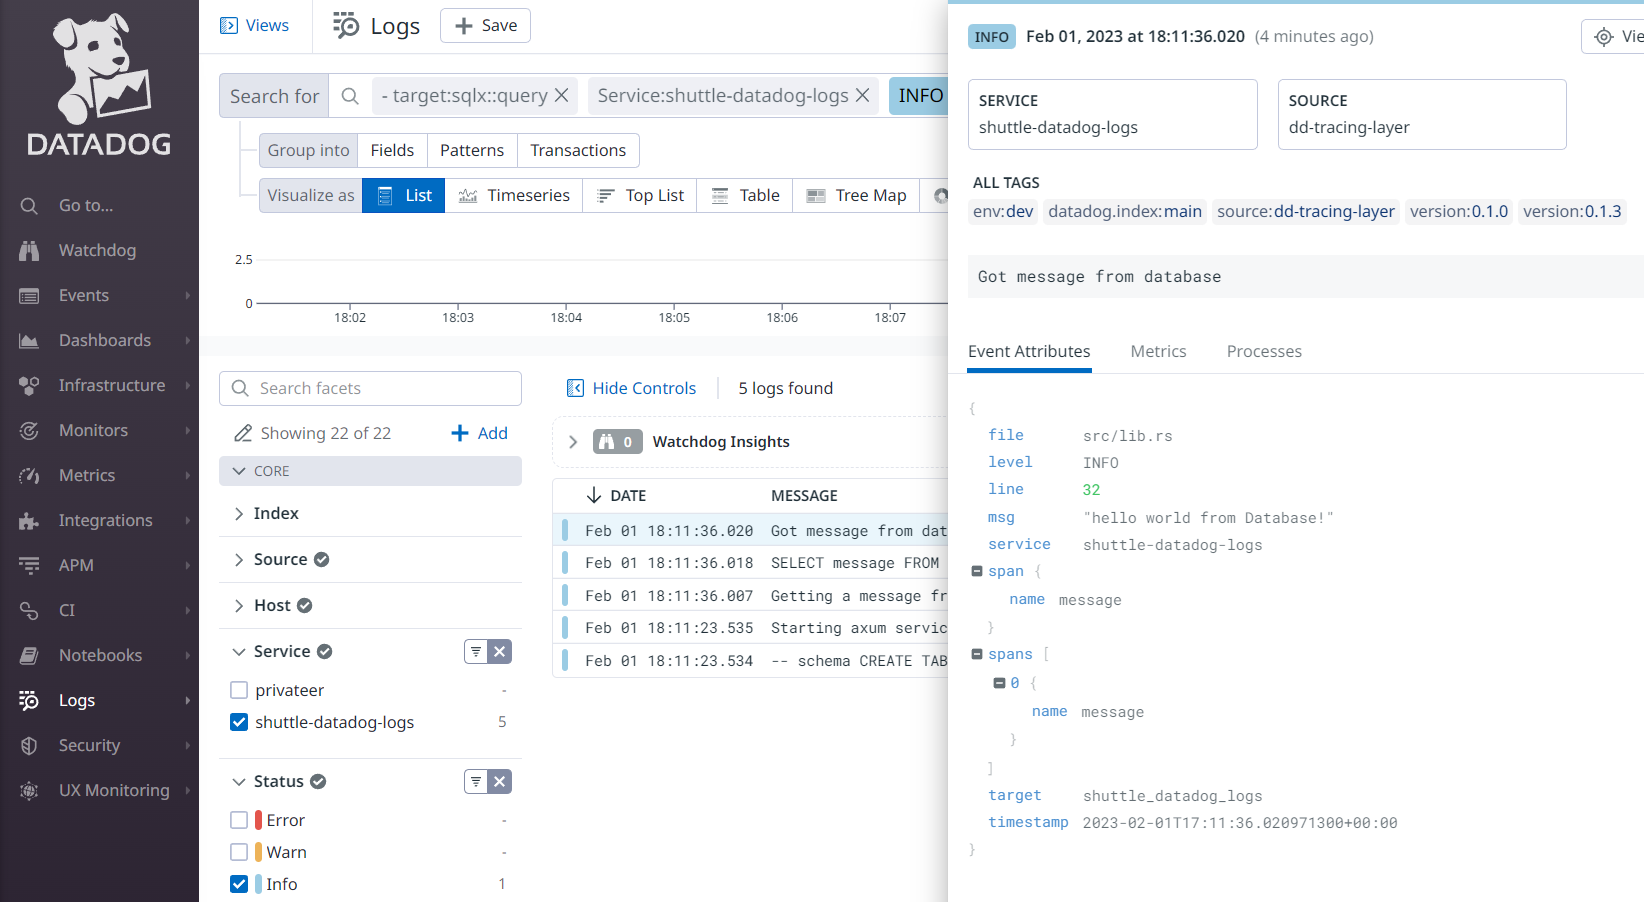
Let’s run the project again and browse to http://localhost:8000/message to see the message from the database:

And now, let’s check the logs in Datadog:

Conclusion
Well, the length of this post is getting a bit out of hand, so I’ll stop here. ![]()
We’ve not only covered how to add Datadog support to our project, but we’ve also shown how to work with databases, secrets, and static folders with Shuttle.
For the moment, it requires a little bit of manual work, but I’m sure that Shuttle will improve this in the future and make this process even easier.
Again, you can see the full code in this GitHub repository
I hope you’ve enjoyed it! ![]()